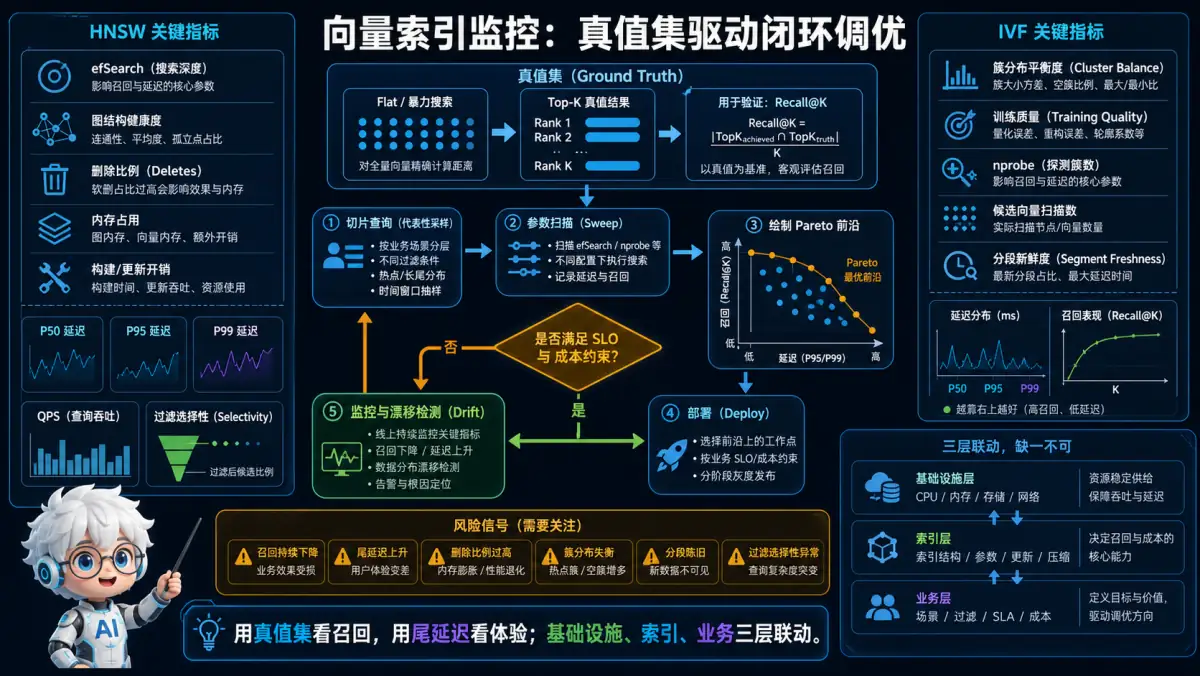
🧠 记忆锚点:用真值集看召回,用尾延迟看体验;基础设施、索引、业务三层联动。
💡 答案要点
为什么向量索引需要专门监控?
RAG 系统的检索质量直接由向量索引决定,但向量索引的监控长期被忽视。传统监控只看 API 延迟,却无法区分"检索慢"是索引问题、网络问题还是模型问题。
HNSW 生产监控四大黄金指标:
| 指标 | 正常范围 | 告警阈值 | 优化手段 |
|---|---|---|---|
| P99 检索延迟 | 5-15ms | >30ms | 调大 M/ef,或切 DiskANN |
| Recall@K | >90% | <85% | 调高 efConstruction |
| 内存使用率 | <70% | >85% | 降维或量化 |
| 索引构建时间 | N×10min | >N×30min | 并行构建或减小数据 |
IVF 监控关键参数:
python
# Milvus/Pinecone IVF 监控参数
{
    "nprobe": 32,        # 搜索簇数,太小→召回降,太大→延迟升
    "nlist": 4096,       # 聚类数,需根据数据量调
    "nlist": 1024,       # 小数据用少簇,大数据用多簇
    "min_train_points_per_cluster": 256  # 避免孤立簇
}
Pinecone/Milvus 监控实战配置:
python
# Prometheus + Grafana 监控配置
metrics = [
    "vector_search_latency_p99",
    "vector_search_recall_actual",    # 需要 ground truth 对比
    "index_memory_usage_bytes",
    "index_build_duration_seconds",
    "query_throughput_qps"
]

# 设置 SLI/SLO
slo = {
    "p99_latency": "<20ms",
    "recall@10": ">88%",
    "availability": ">99.9%"
}
HNSW 参数动态调优:
| 场景 | M | ef | efConstruction | 效果 |
|---|---|---|---|---|
| 追求精度 | 32 | 128 | 200 | 慢但准 |
| 追求速度 | 8 | 32 | 100 | 快但召回降 |
| 平衡模式 | 16 | 64 | 128 | 默认推荐 |
python
# 根据流量动态调整 ef(无需重建索引)
index_config = {
    "ef": 64,  # 在线可调
    "mlock": True  # 锁定内存避免换页
}
向量索引健康检查脚本:
python
def check_vector_index_health(collection):
    stats = collection.get_stats()
    index_type = stats["index_type"]

    if index_type == "HNSW":
        # 检查内存占用
        memory_ratio = stats["memory_usage"] / stats["total_memory"]
        if memory_ratio > 0.85:
            return {"status": "warning", "msg": "内存使用率过高,建议量化"}

        # 检查召回率(抽样验证)
        recall = benchmark_recall(collection, sample_size=1000)
        if recall < 0.88:
            return {"status": "warning", "msg": "召回率偏低,建议调高ef"}

    return {"status": "healthy"}
面试话术:
示例表达(仅在能用本人经历或可复现实验佐证时使用): "向量索引的监控有三个层次:基础设施层(CPU/内存/磁盘IO)、索引层(召回率/延迟/内存占用)、业务层(检索满意度)。很多团队只看 API 延迟,却不知道 P99 30ms 里 20ms 是网络,5ms 是索引,5ms 是模型。分层监控才能定位瓶颈。我们的实践是:HNSW 用 Prometheus 监控内存+延迟,IVF 用 nprobe 动态调整——查询高峰期自动从 32 增加到 64,峰值过后再降回来,这套机制让 P99 延迟稳定在 15ms 以内。"