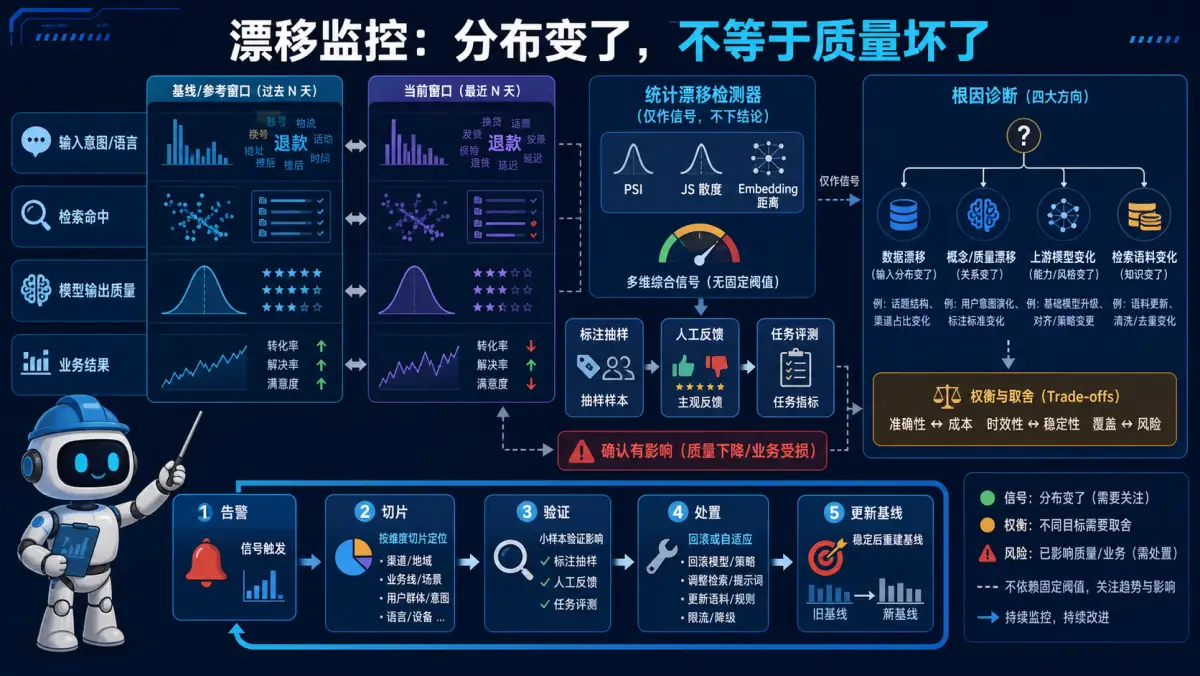
🧠 记忆锚点:分布变化只是调查信号,不等于质量已经变坏;要切片、抽样和任务评测确认影响后再回滚或适配。
💡 答案要点
LLM监控 = 性能监控 + 质量监控 + 成本监控 + 数据漂移监控
核心监控指标
1. 性能指标
python
# Prometheus metrics
from prometheus_client import Histogram, Counter, Gauge

# 延迟分布
latency = Histogram(
    'llm_request_latency_seconds',
    'LLM请求延迟',
    buckets=[0.1, 0.5, 1.0, 2.0, 5.0, 10.0]
)

# TTFT (Time To First Token)
ttft = Histogram(
    'llm_ttft_seconds',
    '首token延迟',
    buckets=[0.05, 0.1, 0.2, 0.5, 1.0]
)

# QPS
qps = Gauge('llm_qps', 'LLM每秒查询数')

# 错误率
errors = Counter('llm_errors_total', 'LLM错误总数', ['error_type'])
告警规则:
yaml
# prometheus-alerts.yml
groups:
  - name: llm_slo
    rules:
      # P99延迟 > 3s
      - alert: HighLatency
        expr: histogram_quantile(0.99, llm_request_latency_seconds) > 3
        for: 5m
        annotations:
          summary: "P99延迟超过3秒"

      # 错误率 > 5%
      - alert: HighErrorRate
        expr: rate(llm_errors_total[5m]) / rate(llm_requests_total[5m]) > 0.05
        annotations:
          summary: "错误率超过5%"

      # TTFT > 1s
      - alert: SlowFirstToken
        expr: histogram_quantile(0.95, llm_ttft_seconds) > 1
        annotations:
          summary: "95%请求首token延迟>1秒"
2. 质量监控
展开 Python 代码示例(32 行)
python
from ragas import evaluate
from ragas.metrics import faithfulness, answer_relevancy

class QualityMonitor:
    def __init__(self):
        self.sample_rate = 0.1  # 采样10%请求

    async def monitor_response(self, query, response, context):
        # 随机采样
        if random.random() > self.sample_rate:
            return

        # 异步评估(不阻塞主流程)
        asyncio.create_task(self._evaluate(query, response, context))

    async def _evaluate(self, query, response, context):
        # RAGAS评估
        result = evaluate(
            dataset={
                "question": [query],
                "answer": [response],
                "contexts": [context]
            },
            metrics=[faithfulness, answer_relevancy]
        )

        # 记录指标
        prometheus_gauge.set(result.faithfulness)

        # 低质量告警
        if result.faithfulness < 0.7:
            send_alert("低质量回答", query, response)
3. 成本监控
python
class CostTracker:
    # 价格表(每1K tokens)
    PRICES = {
        "qwen3.5-plus": {"input": 0.03, "output": 0.06},
        "gpt-3.5": {"input": 0.0015, "output": 0.002}
    }

    def track_request(self, model, input_tokens, output_tokens):
        cost = (
            input_tokens / 1000 * self.PRICES[model]["input"] +
            output_tokens / 1000 * self.PRICES[model]["output"]
        )

        # 记录
        prometheus_counter.inc(cost)

        # 预算告警
        daily_cost = self.get_daily_cost()
        if daily_cost > 1000:  # $1000/天
            send_alert(f"日成本超预算: ${daily_cost}")

        return cost
数据漂移检测
概念:
数据漂移 = 生产数据分布 ≠ 训练数据分布

类型:
1. Input Drift: 用户问题变化(新话题、新场景)
2. Concept Drift: 答案标准变化(政策更新、知识过时)
3. Prediction Drift: 模型输出质量下降
检测方法:
1. 统计检测(KS Test)
展开 Python 代码示例(36 行)
python
from scipy.stats import ks_2samp
import numpy as np

class DriftDetector:
    def __init__(self, baseline_embeddings):
        self.baseline = baseline_embeddings

    def detect_drift(self, current_embeddings):
        # 对每个维度做KS检验
        p_values = []
        for dim in range(self.baseline.shape[1]):
            statistic, p_value = ks_2samp(
                self.baseline[:, dim],
                current_embeddings[:, dim]
            )
            p_values.append(p_value)

        # p-value < 0.05 = 有显著差异
        drift_dimensions = np.sum(np.array(p_values) < 0.05)
        drift_ratio = drift_dimensions / len(p_values)

        if drift_ratio > 0.3:  # 30%维度漂移
            return True, drift_ratio
        return False, drift_ratio

# 使用
baseline_emb = load_training_embeddings()
detector = DriftDetector(baseline_emb)

# 每天检测
current_queries = get_today_queries()
current_emb = embed_model.encode(current_queries)

has_drift, ratio = detector.detect_drift(current_emb)
if has_drift:
    alert(f"检测到输入漂移: {ratio:.1%}维度变化")
2. 语义相似度监控
python
def monitor_semantic_drift(new_queries, baseline_queries):
    # 计算新查询与baseline的平均相似度
    new_emb = embed_model.encode(new_queries)
    baseline_emb = embed_model.encode(baseline_queries)

    # 余弦相似度
    similarity = cosine_similarity(
        new_emb.mean(axis=0).reshape(1, -1),
        baseline_emb.mean(axis=0).reshape(1, -1)
    )[0][0]

    # 相似度<0.7 = 漂移
    if similarity < 0.7:
        return True, similarity
    return False, similarity
3. 性能下降检测
python
import evidently
from evidently.metric_preset import DataDriftPreset

# Evidently监控
report = evidently.Report(metrics=[
    DataDriftPreset()
])

report.run(
    reference_data=baseline_df,  # 训练集
    current_data=production_df    # 最近7天生产数据
)

# 生成HTML报告
report.save_html("drift_report.html")

# 提取漂移指标
drift_share = report.as_dict()['metrics'][0]['result']['drift_share']
if drift_share > 0.5:
    alert(f"数据漂移严重: {drift_share:.1%}特征漂移")
完整监控Dashboard (Grafana):
展开 SQL 代码示例(31 行)
sql
-- Panel 1: QPS趋势
SELECT
  time,
  rate(llm_requests_total[1m]) as qps
FROM prometheus
WHERE time > now() - 24h

-- Panel 2: 延迟分布
SELECT
  percentile(latency, 50) as p50,
  percentile(latency, 95) as p95,
  percentile(latency, 99) as p99
FROM llm_metrics
WHERE time > now() - 1h

-- Panel 3: 成本趋势
SELECT
  date,
  SUM(cost) as daily_cost
FROM cost_tracker
GROUP BY date
ORDER BY date DESC
LIMIT 30

-- Panel 4: 质量分数
SELECT
  time,
  avg(faithfulness) as avg_faithfulness,
  avg(relevancy) as avg_relevancy
FROM quality_metrics
WHERE time > now() - 7d
面试话术:
"LLM监控分4层: 1)性能监控P99延迟/TTFT 2)质量监控RAGAS采样评估 3)成本监控token消耗预算告警 4)数据漂移用KS检验+Evidently。我们每天自动生成漂移报告,漂移>30%触发模型重训。"